Hello Pandas!
Let’s help WTWY
In my endeavor to help a fictitious NGO called WomenTechWomenYes (WTWY), aiming to raise money for their cause through a Spring GALA, organized annually in the month of May - I decided to figure out which locations in NYC would be most suited for their street teams to hand out pamphlets to potential attendees such that they can maximize attendance and donation.
Let’s get some data
Best place to get data about humans congregating in specific areas of NYC? The NYC subway station company. The Metropolitan Transportation Authority is nice enough to post weekly Turnstile data for all subway stations in New York City.
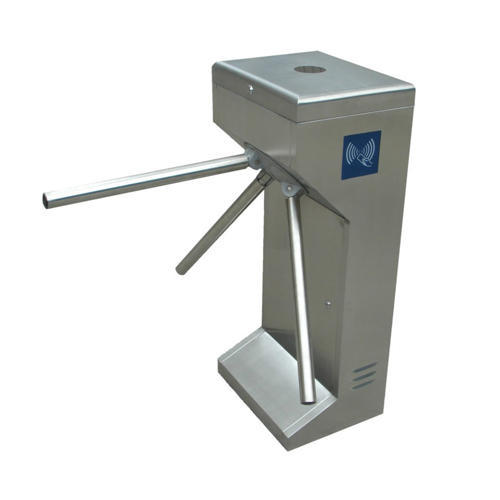
What’s a Turnstile you ask? A Turnstile is the metal barrier you push through to enter/exit a station. Each station has multiple Turnstiles, often grouped together in groups of 2 or more.
This data may be found here.
What do your computer eyes see, Python?
Average attendees
I find that the number of data points per day remains fairly consistent.
Then, I’m able to calculate the total number of entries per Turnstile per day.
As can be seen from the graph below, majority of the data points are between 0 and ~75 million.
Zooming in, I see no real variation in my histogram until

Let’s zoom in….
Hmmm....

Let's look at a histogram to get an idea of what the frequency of number of entries looks like.