I had the pleasure of working with Home Chef, a subscription based meal delivery company based in Chicago.
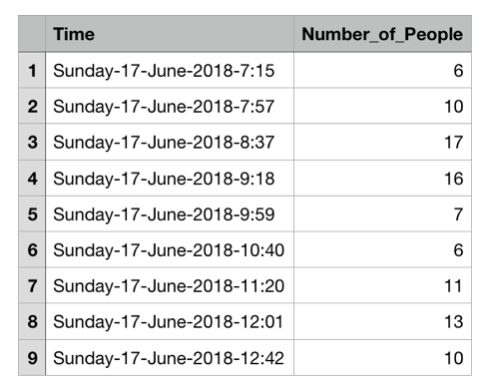
Home Chef carries out it’s operations in a big part by leveraging an efficient service line using a flexible workforce that can be deployed to complete different task as per needs. Something they could use was information on how many employees are working on a line at any given time, ideally in real-time.
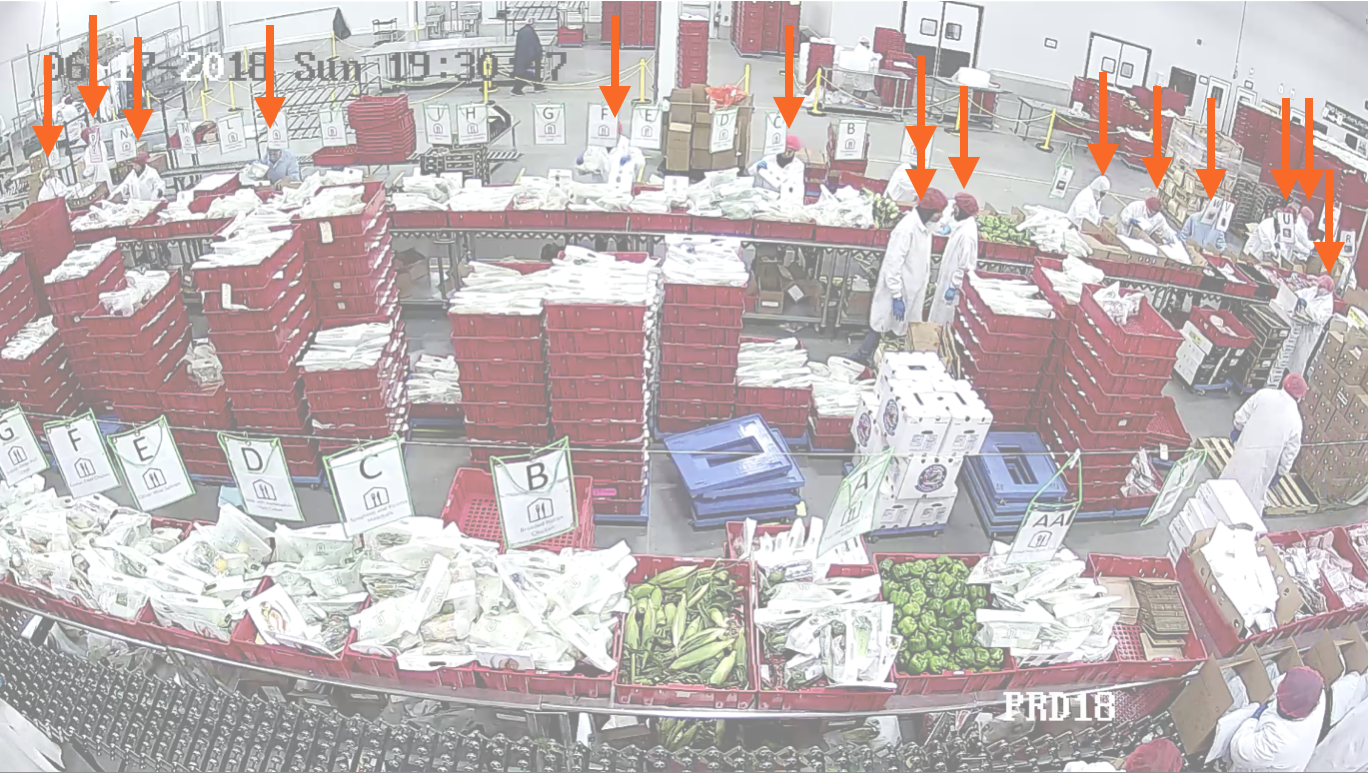
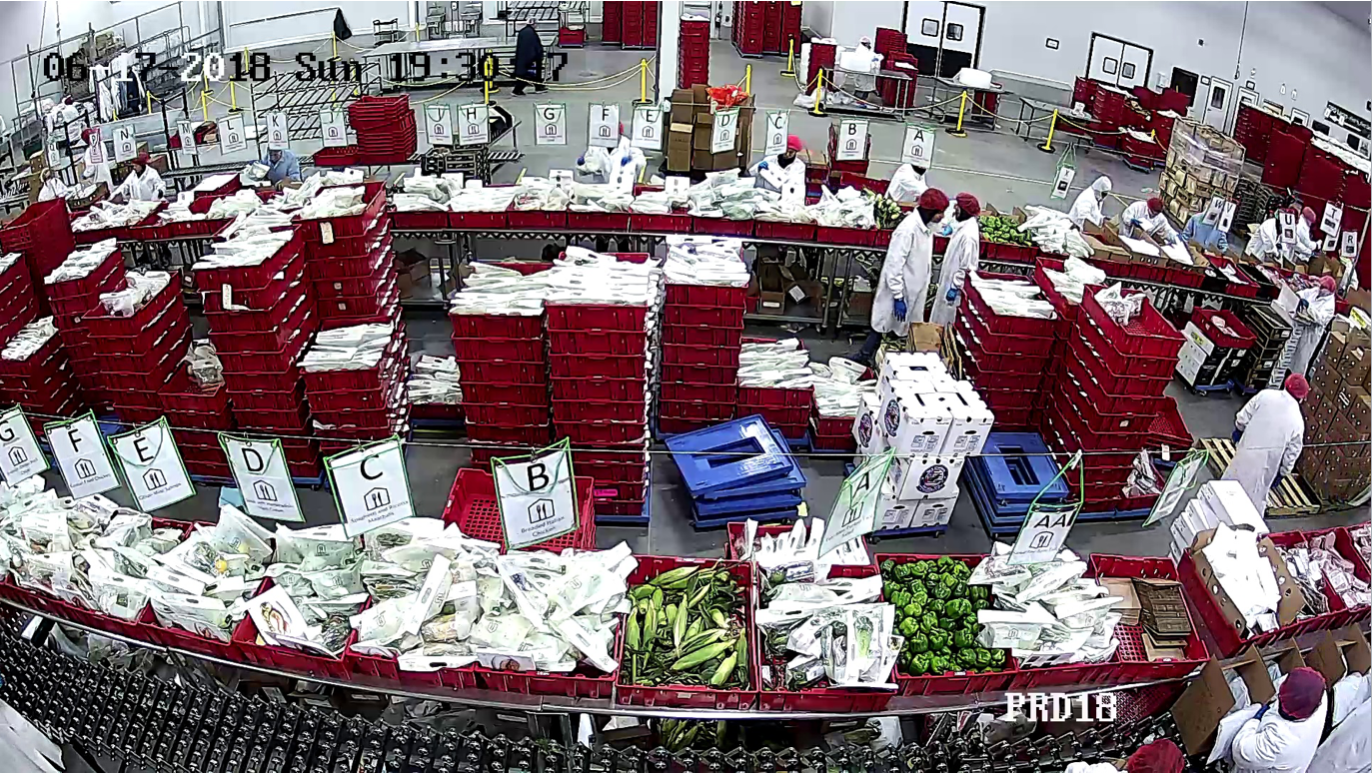
To that effect, they provided me with access to a camera feed pointed at one of the assembly lines.
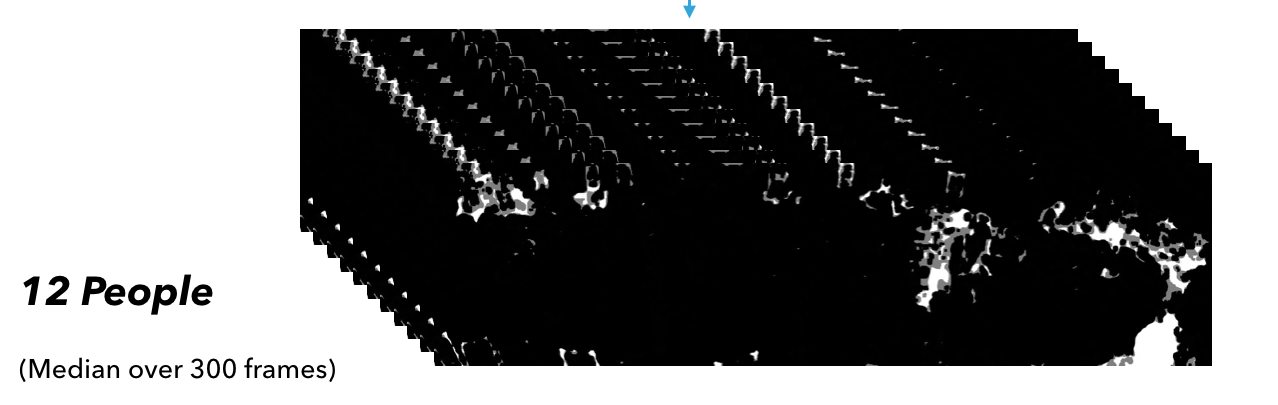
And our aim here is to count these people:
Approach
I used an unsupervised approach for this project.
A video through the camera’s web interface is downloaded and then passed on to the program as an argument, along with a start and end time (in seconds). The video is split to only include the portion between the start and the end time.
The camera records at 30fps with a resolution of 1920*1080.
From the split video:
All frames are extracted.
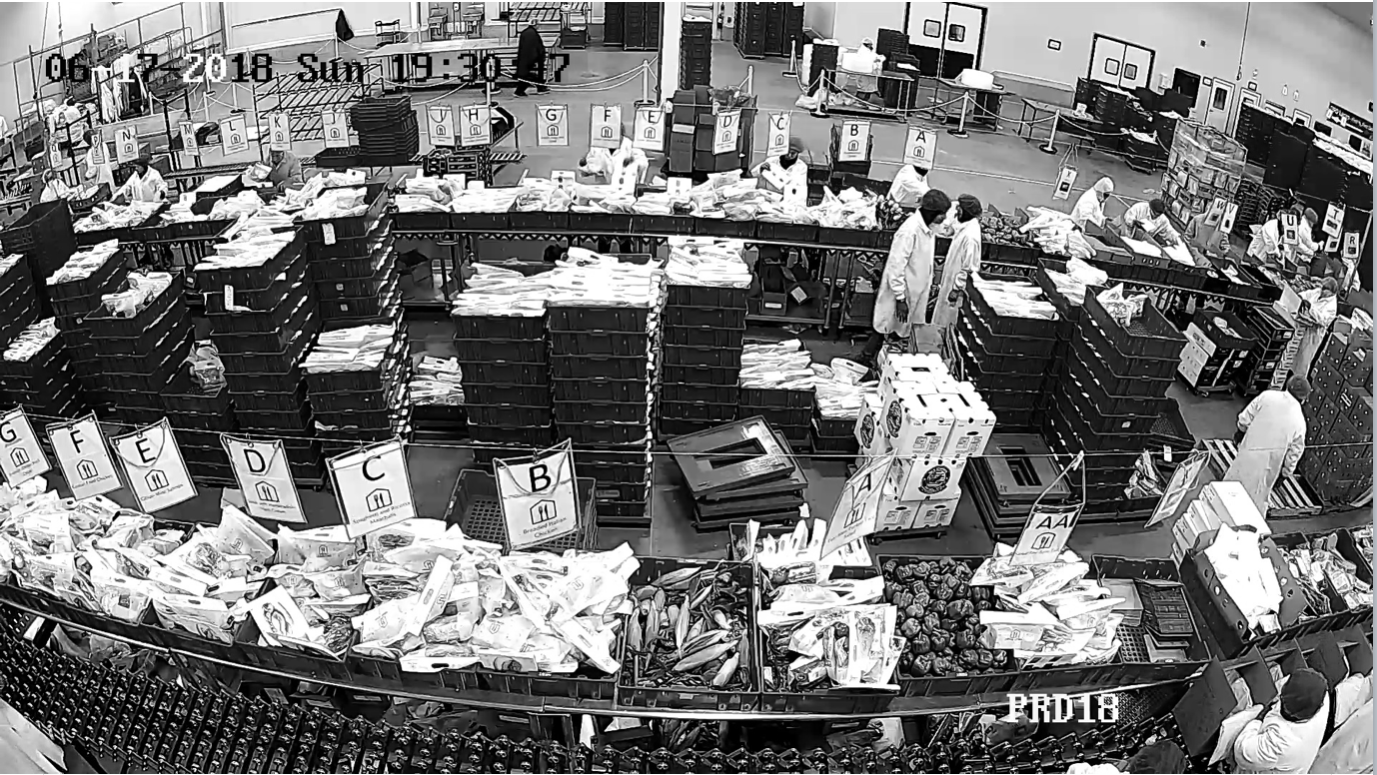
The frames are converted to grayscale.
The grayscale frames are cropped to 1920*500.
Mixture of Gaussian (MoG) is applied to all frames.
The GIF exceeds the size Github allows to upload so I’ve uploaded it here on imgur!
Results of MoG are saved.
To each MoG frame, a median filter is applied to reduce noise.
Median of Connected Components over 300 frames taken to arrive at answer.
Some of the advantages of using an unsupervised approach such as this over a deep learning/network based approach is that this allows much greater flexibility of deployment i.e. the skeleton of this algorithm may be applied to any other project where it’s desired to count any moving entities. Another advantage is that this algorithm is a lot ‘lighter’ than a deep learning model which would take a long time to train.
Results
Algorithm was tested over different time frames and compared to manually counting number of people by eye.
It was found that the algorithm was consistently off by +/- 2 people. However, when there were no people on the assembly line - the algorithm reported figures of 5/6 people.
Since the algorithm works off movement, it someone did not move over a period of 10 seconds they were not counted.
Improvements
Taking median of Connected Components over more frames (~300 seconds) by leveraging more processing power through AWS could further help with accuracy.
Using a camera with a wider field-of-view to capture movement in the extremities.
Taking image from 2 cameras placed on different sides and using frames from both to average out discrepancies.
A new young technology that promises to disrupt many industries. Those that believe in it, swear by it’s revolutionary potential. However, if they are asked to elaborate on their position, they might not be able to provide you with a clear, concise use case of how exactly it’s bringing utility or what justifies the exponential increment in the cost of it’s projects which at best are proof-of-concepts and at worst outright scams. A lot of their belief stems from it’s potential at some future time, not what it’s actually producing at the moment.
Brands, Companies, Corporations, Celebrities are all catching on to this hoping to ride the wave, which surely seems like a fad and every month there’s a new team promising to give you the tech’s best implementation and offering you a stake/opportunity to be a part of their success.
Neutrals remain extremely skeptical and are not convinced that this will end well. Despite these concerns, the technology continues to move forward - maybe at a pace that does not keep up with the valuation, but forward nonetheless.
What technology am I talking about?
The year is 1998 and I am talking about the internet.
Introduction
The parallels between the Internet/websites in the late 90s and Blockchain/cryptocurrencies today are quite analogous.
In this spirit of trading - I am going to use my Natural Language Processing (NLP) powers to see if I can train a machine to determine the sentiment of a market by ‘reading’ comments from a popular cryptocurrency forum - r/EthTrader, a subreddit to discuss price/news/updates about the Ethereum platform.
I look at comments from three periods in Ethereum’s recent history:
A bullish period between December 1 - December 15, 2017 where the price went up from $469 to $696, an increase of 48%!
A bearish period between July 1 - July 15, 2017 where the price went down from $274 to $170, a decrease of 38%!
A period of consolidation between October 15, 2017 - October 30, 2017 where the price consolidated between $336 and $308.
Getting Data
To interact with reddit through Python, I used PRAW, a Python wrapper for Reddit’s API. A problem I encountered here was that while PRAW lets you look at different threads and their contents from a subreddit TODAY, I couldn’t find any functionality to query dates and look at threads from an older period.
To be able to complete the project, I required the ability to search for a specific date I am interested in, open the associated thread and download all the comments (parent/children/grandchildren and so on) from it.
I used the following process to achieve this:
Navigate to the r/Ethtrader page on reddit (Achieved using Selenium).
Search for the interested date through the search bar on the page (Achieved using Selenium).
Select the correct link from the corresponding results, grab the postID from the URL and store in a dictionary (Achieved using a combination of Selenium and BeautifulSoup).
Use the postID with PRAW to download comments for the thread (Achieved using PRAW).
Save the comments (Achieved using the ‘Pickle’ library and MongoDB).
This would need to be repeated for each date, so I downloaded and stored the postIDs of all the dates I was interested in as a pickle file.
Now, for each period (Consolidation, Bear, Bull) I was interested in, I created a dictionary with the date as key and the postID as value.
A function that, given a postID, downloads all the comments (parent/children/grandchildren and so on) from the thread is then used to save the comments for each day in a list that contains the date, postID and the corresponding comments.
This list is then stored in MongoDB.
Code used to achieve this can be found in the downloadData.py file!
Preparing comments for analysis
Let’s look at a comment from a bear period to understand what we’re working with:
As a human, I deconstruct this comment by reading it and arriving at a summary that conveys the meaning.
The summary is, that this person after repeated failures has now learned how to trade (made 10 extra ETH), is going to stop looking at the prices, transfer his ETH to a wallet (hodl) and return to it at a later date. Person also wishes everyone good luck.
To use this comment in the context of NLP and training a model, the elements that provide valuable information are words, specifically words that contain information within them.
Cleaning
To clean this comment such that it’s in a usable format before feeding into an algorithm:
Remove punctuation (Achieved using regex substitution).
Remove empty lines (Achieved using regex substitution).
Lowercase all letters (Achieved using a method from the string library).
Remove all stop words - Stop Words are words that don’t contain any useful information in them by themselves like the, of, for, is etc. (Stop words imported from nltk.corpus).
I create a function that performs the above for each comment in my corpus of comments. The result of applying this function to the above comment yields:
Count Vectorizer
For a computer to be able to analyze large amounts of Natural Language data, we need to find a way to represent each comment ‘quantitatively’.
This is achieved by parsing the comment to remove words (called tokenization). Then the words need to be encoded as integers for use as input to an algorithm, called feature extraction (or vectorization).
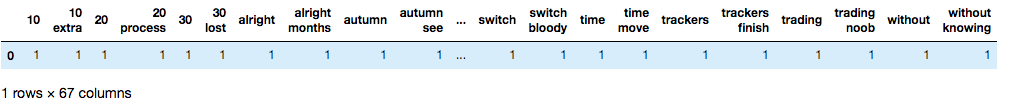
Each word in the comment becomes a feature and how many times it occurs in our comment becomes it’s value, our output looks like this:
I used Count Vectorizer to produce unigrams and bigrams. Unigrams are single words and bigrams are groups of two words. Count Vectorizer gives a frequency of every unigram and bigram that occurs in the comment i.e. every unigram and bigram is turned into a feature.
Count Vectorizer is applied to the entire corpus of comments. To further clean the corpus and remove features that do not provide much information about the sentiment, max_df is set to 0.4 and min_df is set to 5.
max_df = 0.4 means “ignore terms that appear in more than 40% of the documents”.
min_df = 5 means “ignore terms that appear in less than 5 documents”.
TF-IDF
Term Frequency - Inverse Document Frequency or TF-IDF is another tool used to quantify text data. TF-IDF is used to evaluate how important a word is to a document in a corpus. The importance increases proportionally to the number of times a word appears in the document but is offset by the frequency of the word in the corpus.
For our comment above, we get the following output:
Note that since we have already removed words that were occurring frequently through our cleaning function, TF-IDF gives most of the unigrams and bigrams equal importance. Hence, it doesn’t provide extra value in our case . We will continue to use our Count Vectorizer output.
Most Popular phrases
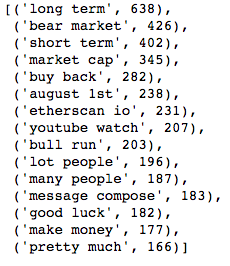
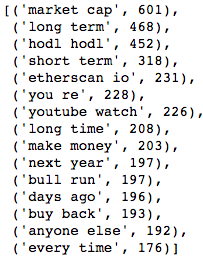
After quantifying the text data from the comments, we can identify some of the most frequently occurring bigrams during the three different periods:
Bear Period:
Bull Period:
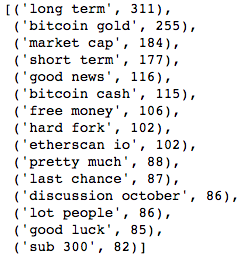
Consolidation Period:
Modeling
After downloading all comments, I get the following numbers:
Bear Comments: 99,314
Bull Comments: 65,766
Consolidation Comments: 25,471
We have almost 4 and 2 times as many comments during the bear period as we have during the consolidation and bull periods respectively.
A reason for this is that during bear periods, especially when there is a sharp decline of over 10% during a single day - the volume of comments increases by a huge margin.
To offset this discrepancy and also delineate between Bear periods and periods of sharp decline, I further split the Bear Comments into 2 categories: Pullback Comments (Periods during which price declined by greater than 10% in a single day) and Bear Comments (the rest).
To the list of comments from each period, I append a number to ‘mark’ what period each comment represents:
Bull Data - labeled 3
Bear Data - labeled 2
Pullback Data - labeled 1
Consolidation Data - labeled 0
I remove 30% of the data to use later for testing and validation purposes. Cleaning function is applied to the entire corpus followed by Count Vectorizer.
The output of Count Vectorizer is 133,000 comments with almost 26,000 features!! My humble 2015 Macbook Pro doesn’t have enough juice to process that many numbers, especially if I wish to try computationally expensive models KNN.
Singular Value Decomposition (SVD)
Fortunately, a technique called Singular Value Decomposition (or SVD) can help out here. SVD can be used to reduce the size of our data while preserving the information it contains.
At a high level - SVD is used to take a higher rank matrix, say of rank R and reduce it to a lower rank, K. This is done by taking the R unique vectors and finding a way to approximate them into linear combinations of K unique vectors.
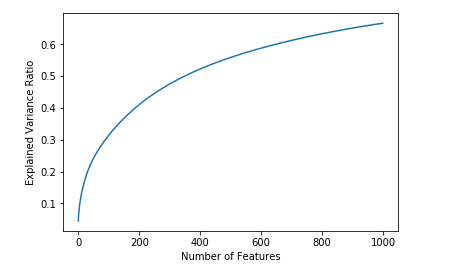
Here, the original matrix is of m x n dimensions where m is 133,000 (number of comments) and n is 26,000 (number of unique unigrams and bigrams). Those 26,000 unique features can be represented by a combination of 1000 unique features (70% of the information is preserved). Notice how even if I increase the number of features by 5 times to 5000, the explained variance ratio doesn’t increase by that much.
Once we have our SVD data, we can begin training our models.
Dummy classifier
I use a Dummy Classifier and test it against the test set to establish a baseline accuracy to compare against with our models moving forward.
Stratified (generates predictions by respecting the training set’s class distribution) - 27% accurate
Most Frequent (always predicts the most frequent label in the training set) - 35% accurate
Prior (always predicts the class that maximizes the class prior) - 35% accurate
Uniform (generates predictions uniformly at random) - 24% accurate
It can be seen that by just always predicting the most commonly occurring label - Bullish, we can get an accuracy of 35%!
Let’s see how the other algorithms fare in comparison.
Logistic Regression
Let’s begin with Logistic Regression!
L1 (Lasso) Regularization w/ class weight ‘Balanced’ = 43% accurate
L2 (Ridge) Regularization w/ class weight left as it is = 44% accurate
Better than our dummy model benchmark of 35% but not something I’d use to decide if I should be going long or short!
Gaussian Naive-Bayes
Next up is Gaussian Naive-Bayes and it returns an accuracy of just 25.7%! This makes sense as Naive-Bayes doesn’t perform well when the features are NOT independent, which is the case with our data. A basic assumption Naive-Bayes makes is that all features are independent!
Linear SVM
Training a Support Vector Machine on such a large data takes a long time! It took almost 45 minutes for the Linear SVC to train on the train data. With class weight Balanced, the results though weren’t anything to write home about. The Linear SVC performs better than Naive-Bayes and similar to Logistic Regression yielding a final accuracy of 43%!
Random Forest
Finally the Random Forest Classifier, a tree based algorithm that in the projects I’ve worked so far usually performs really well yields an accuracy of only 33%. This makes sense, as trees in general fail when the data is sparse.
Conclusion
Well, so there you have it - my attempt at quantifying subjective text data and training algorithms to find information within them. However, as can be seen above - Logistic Regression which is our best performing classifier has an accuracy of only 44%. Hence, it is not something I would make trading decisions based on.
Some things that can be used to improve performance:
Download and train with more data and over longer periods.
Train using a beefier, more powerful machine, like an AWS instance with additional RAM and processing power to use more features following Singular Value Decomposition, to capture more of the explained variance ratio.
Train using Neural Networks, use Word2Vec to find more sophisticated semantic relationships.