Linear Regression & The Price of Gold
What contributes to the price of a shiny metal?
Decided to use my new found Linear Regression and Web Scraping powers to find a relationship between the price of an ounce of Gold and the following features:
-
The ThomasRetuters Core Commodity Index Fund (CRB) This Index Fund is made up of 19 commodities - with 39% allocated to energy contracts, 41% to agriculture, 7% to precious metals and 13% to industrial metals.
-
Monthly Inflation Rate How much is USD worth today compared to how much it was worth a month ago?
-
M1 Money Supply How much USD has the Federal Reserve printed?
-
EURUSD How much USD does it take to buy 1 EUR?
After establishing these as my features, I decided to get my data.
–> Scraped the price of Gold using Selenium from this website.
–>Inflation Data was scraped using Selenium from this one.
–>The other websites were nice enough to provide a direct download link!
Analysis
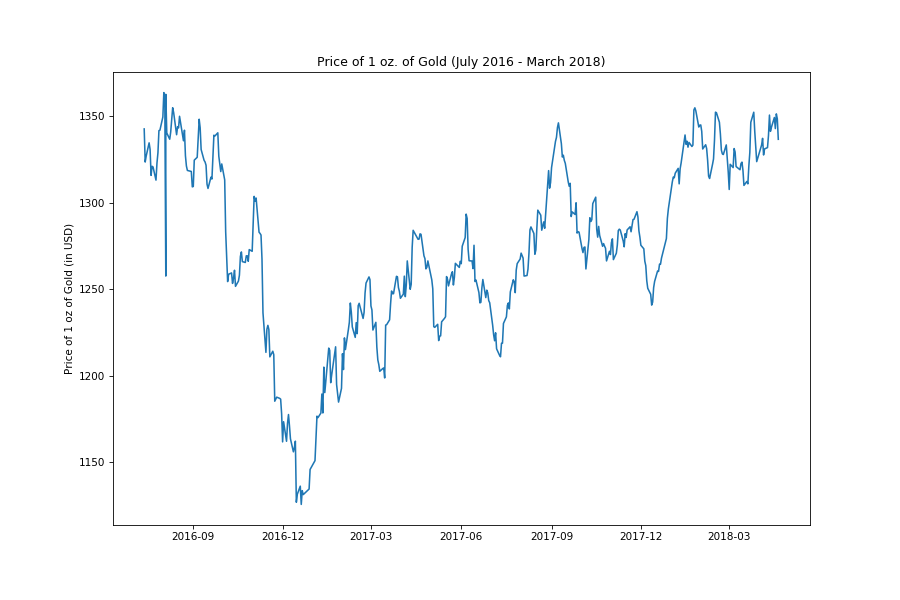
Let’s look at the price of gold between August 2016 and April 2018.
Now, let’s look at all our features over the same period.
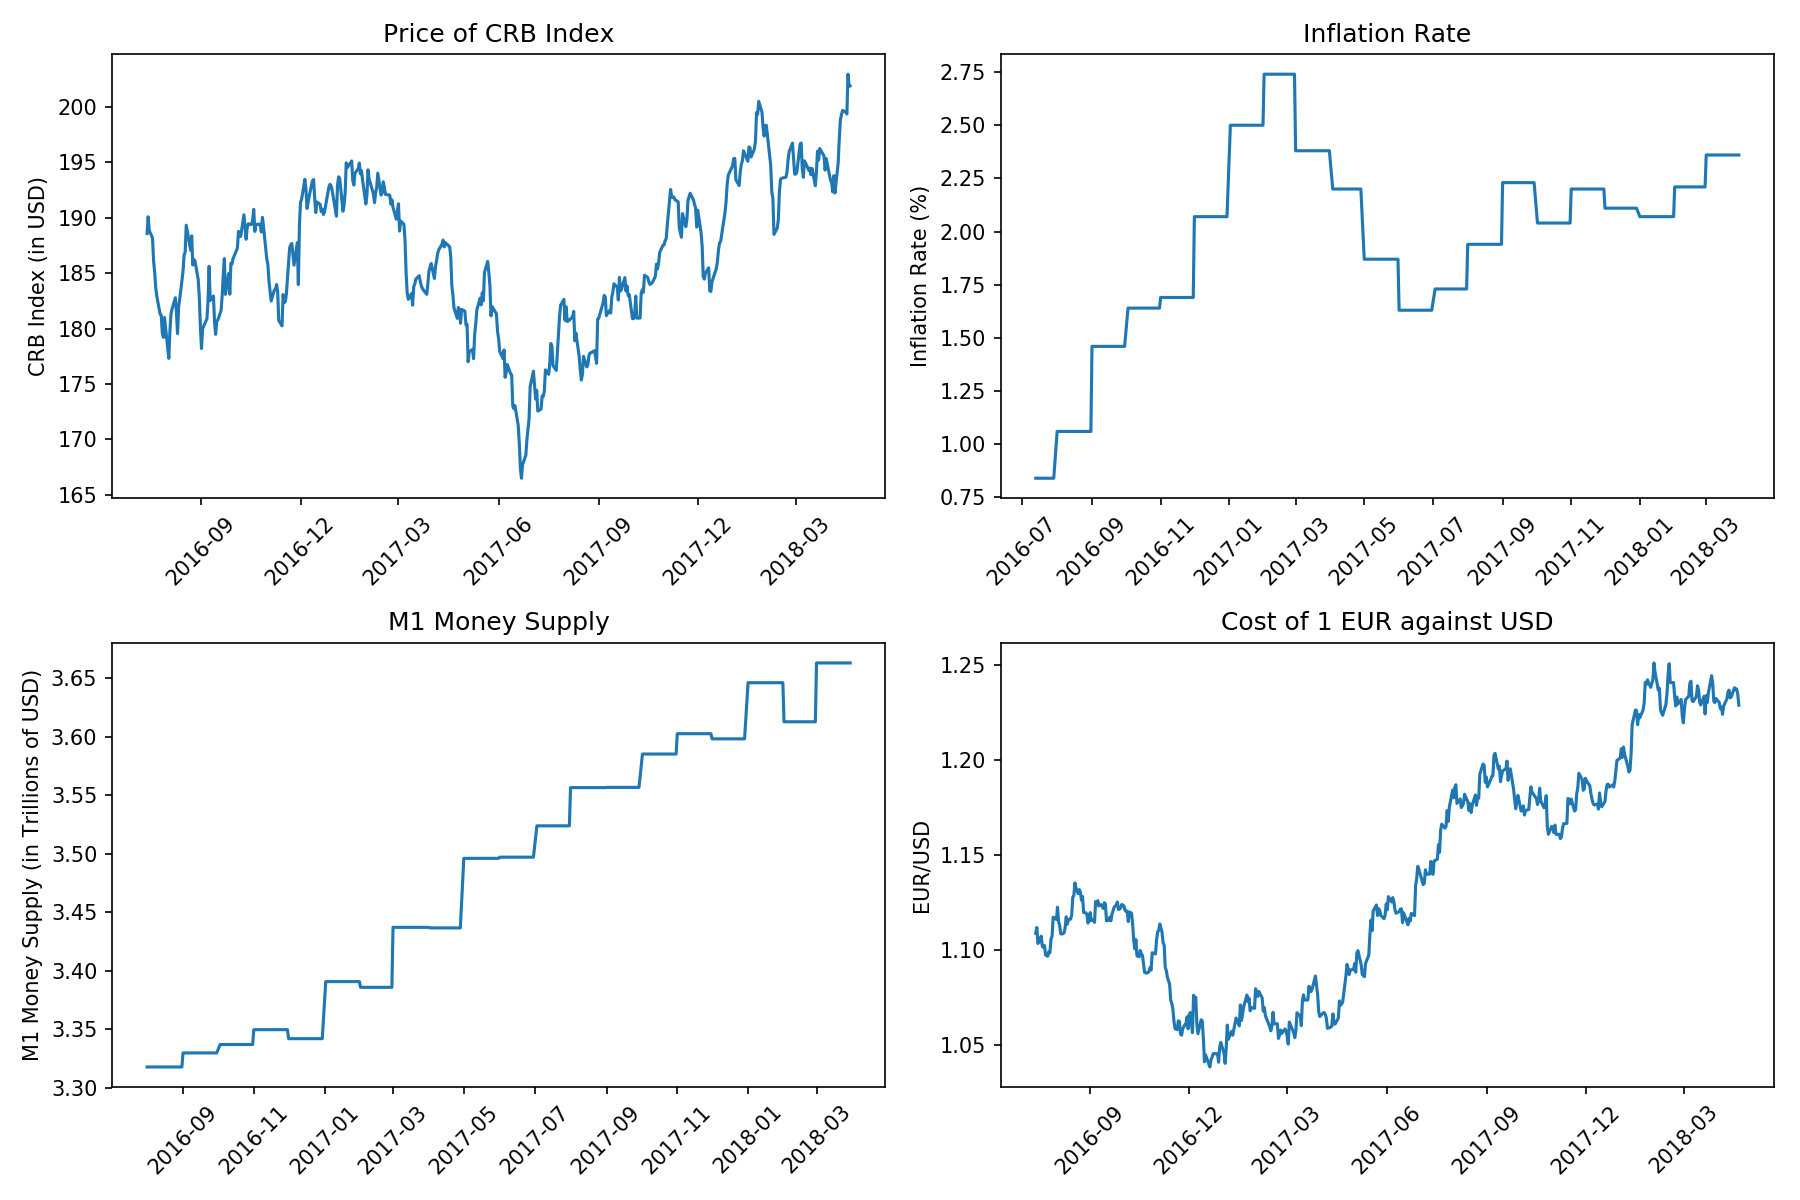
Do you see some trends? Good. Let’s see if we can find a nice little equation that captures this relationship.
Before we dive into actually finding our equation, Let’s find out-
How are these features related to the price of Gold?
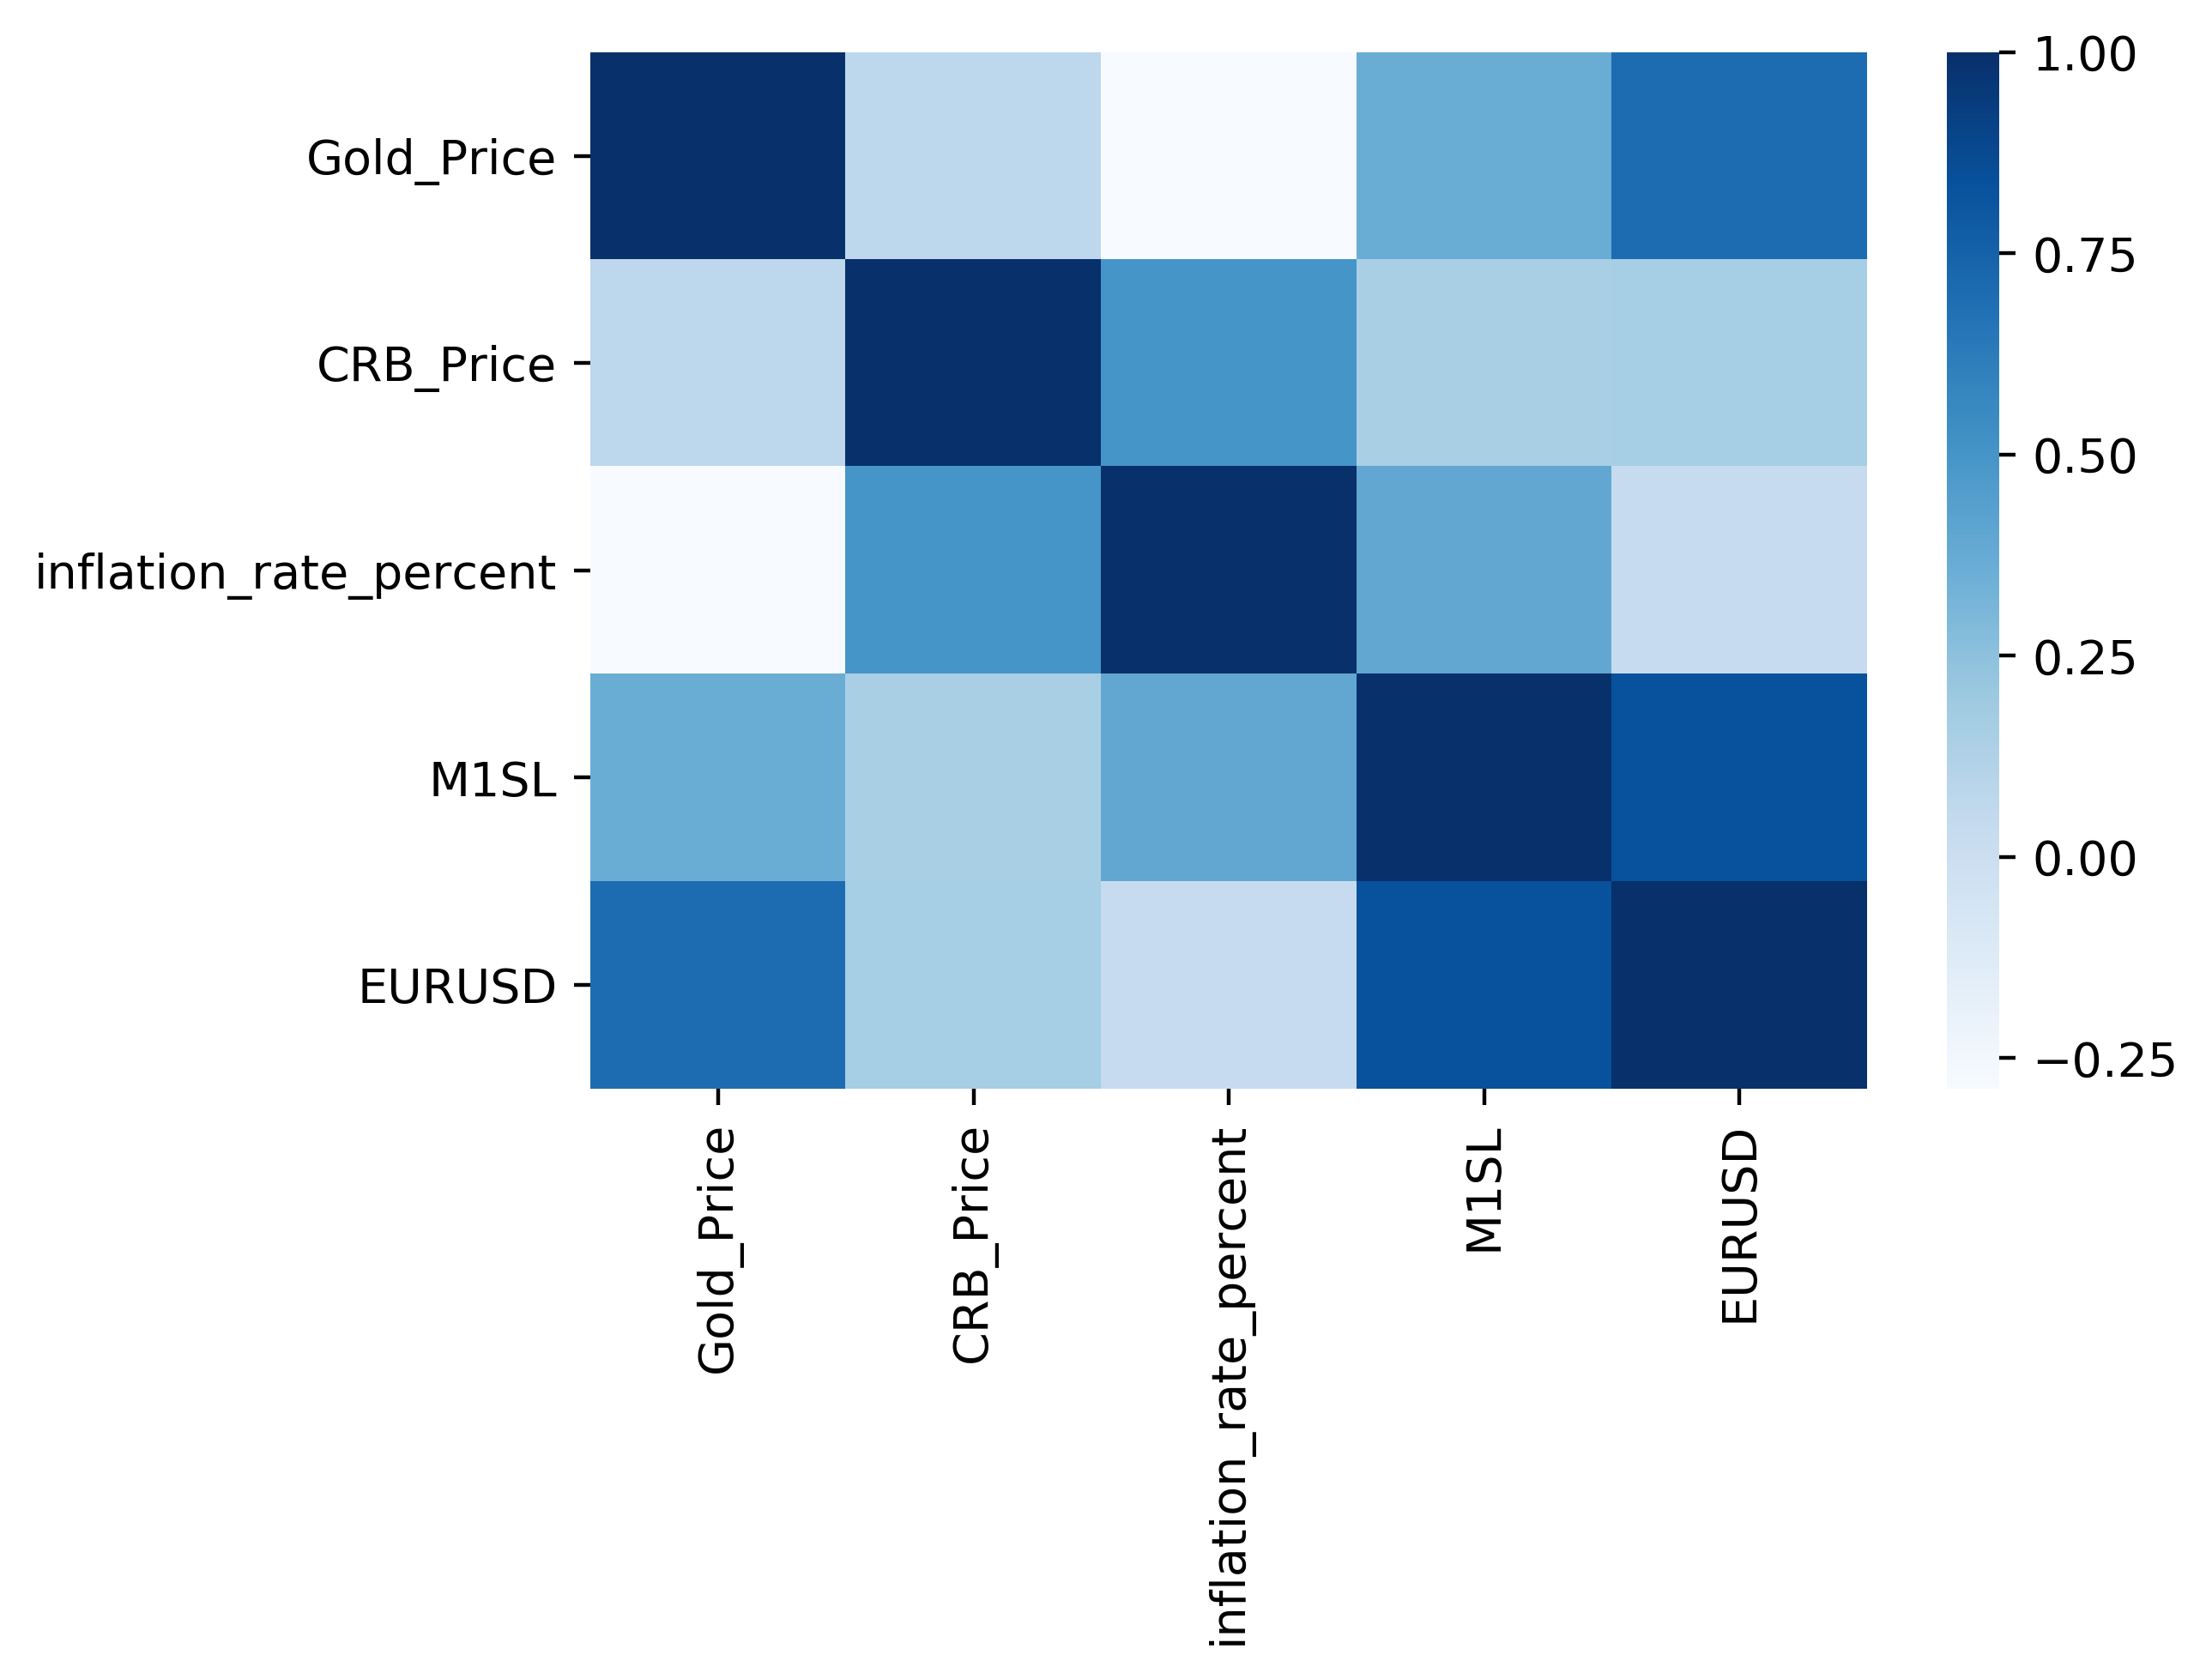
From this correlation heat-map, we see that of our 4 features, EURUSD seems to be the most correlated to the price of Gold, followed by M1SL, inflation rate (negatively correlated) and lastly the CRB index.
Linear Regression
I start simple. Using the good old Ordinary Least Squares method, I get:
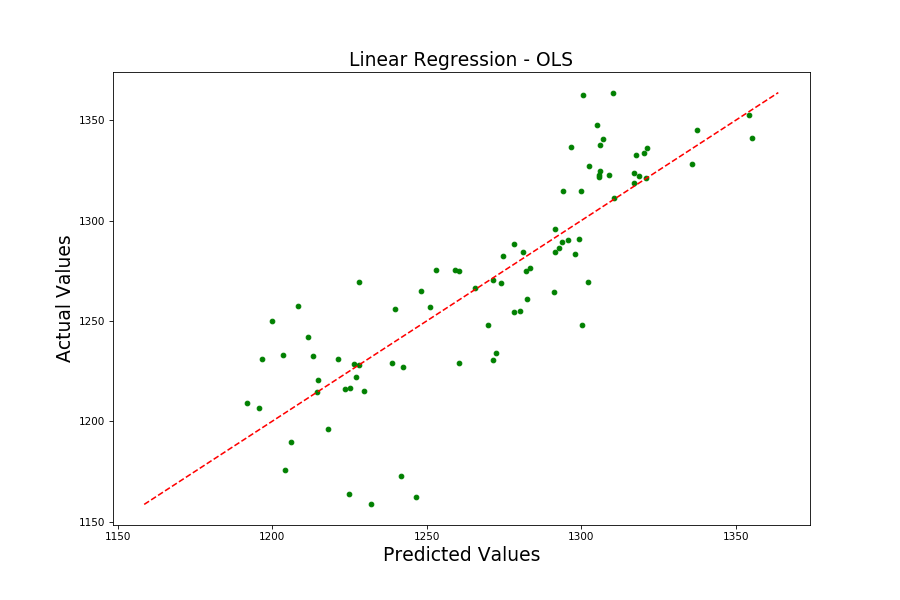
With an R^2 score of 0.67, and a Mean Absolute Error (MAE) of $28, while it’s not abysmal. It’s surely not very good. Also, notice how whenever the price is over $1300, my model does terribly.
Clearly there are some relationships that my model is not picking out on.
What if I try adding Polynomial Features into the mix? Basically, I’m giving my model permission to use features like EURUSD * M1 Money Supply or CRB Index^2.
My model immediately does better -
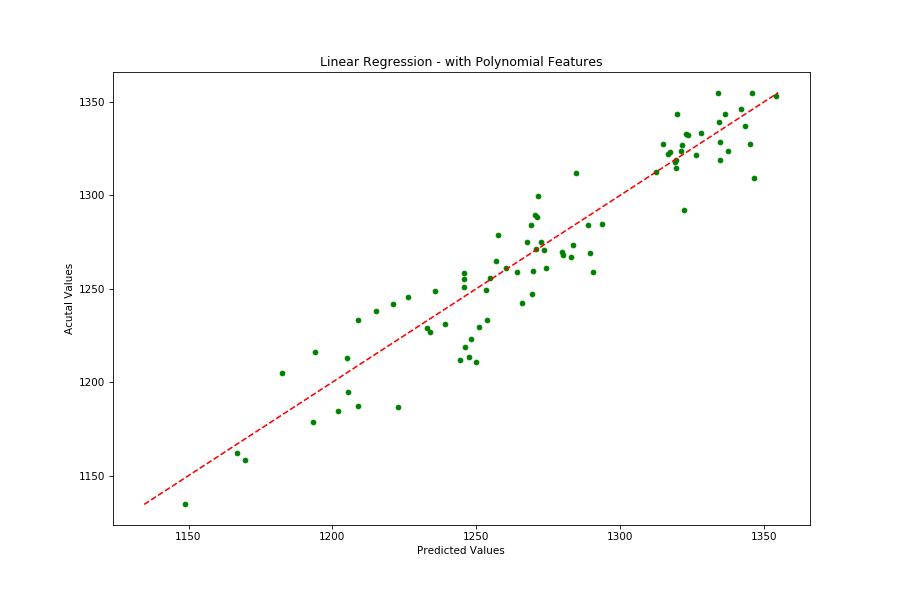
Note that here I am using 2nd degree Polynomial Features. My R^2 is up to 0.82 and MAE is down to $15.
Pretty neat huh? Clearly my chosen features have a relationship with the price of an ounce of gold! Yay!
What’s next?
The next step is to add a time series component to this analysis to ‘predict’ the future price given historical price. Start by trying some simple Auto-Regressive/Moving Average models. Maybe see how the recently released Facebook Prophet library fares. Once you know Linear Regression, the possibilities are endless!
**I will be uploading my notebook with all the code to achieve all of the above to my Github repo shortly! Stay tuned! **